Rawaz Sulaiman
Market Research | Data Analyst
About Me
Hi! I am Rawaz Sulaiman, a dedicated professional with over 10 years of experience in market research and data analytics.My technical skills encompass a wide range of analytical tools (Excel & SPSS), BI tools (Power BI) and survey programming (SurveyToGo).I possess a keen analytical mindset, allowing me to derive actionable insights from complex data sets and contribute to informed decision-making. I am passionate about leveraging data to uncover trends and drive strategic initiatives that enhance business performance.
Skills
Excel | Power BI | SPSS | Survey Programming
Data Analysis | Visualization
Report Development
Fieldwork Management
Team Management
Professional Certificates
My growing list of exam-based certifications
Featured Projectes
SPSS, EXCEL & Power point | Consumer Survey – Internet Service Providers Market Analysis Report
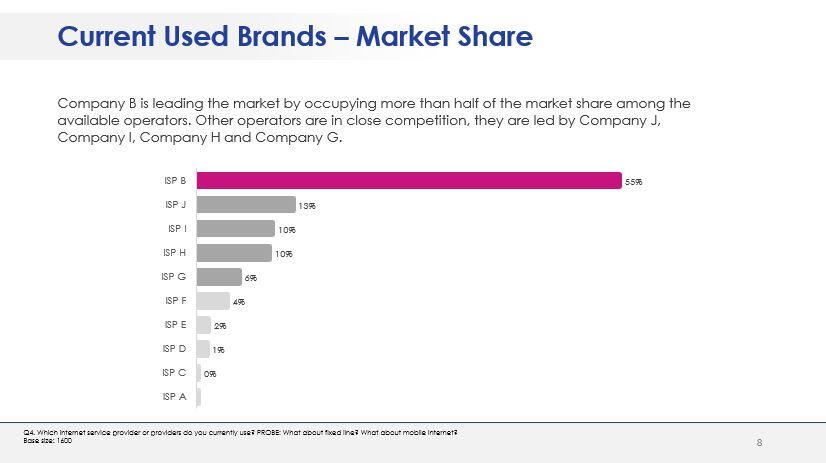
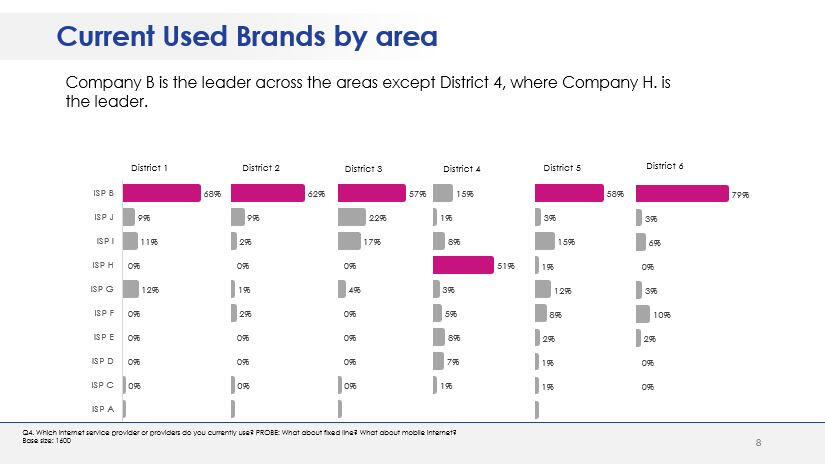
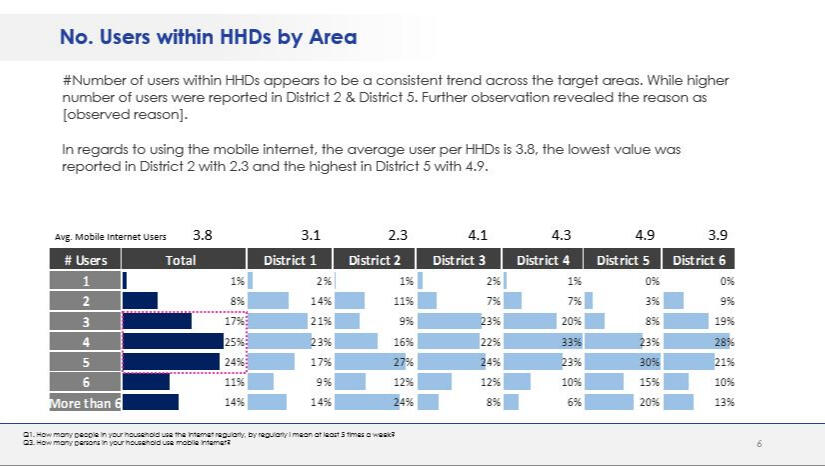
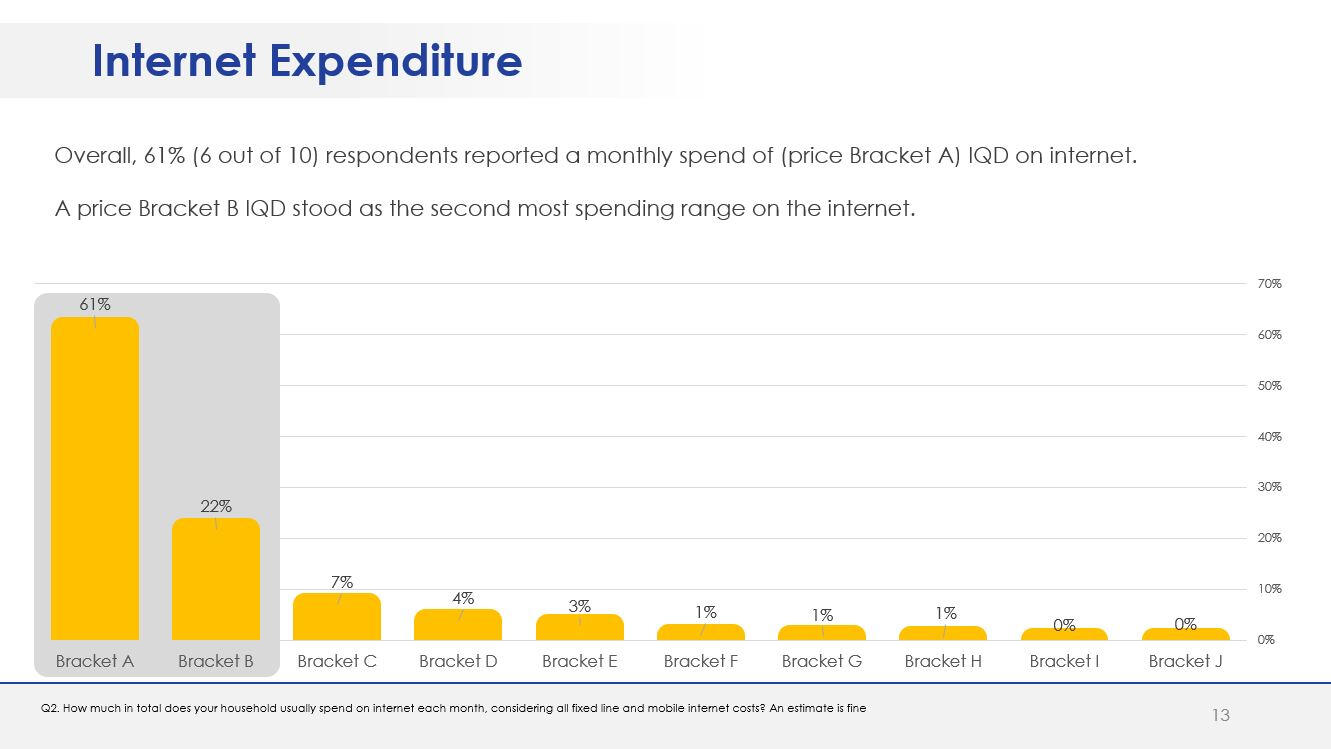
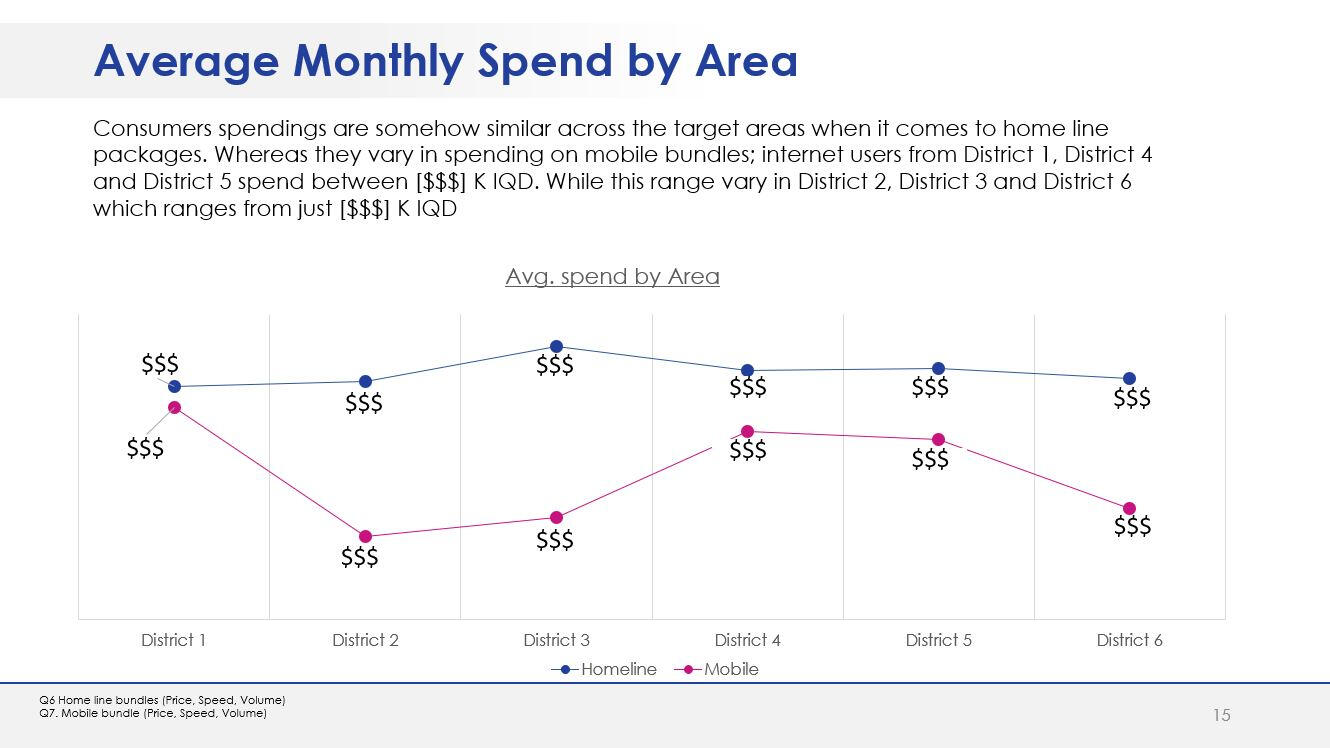
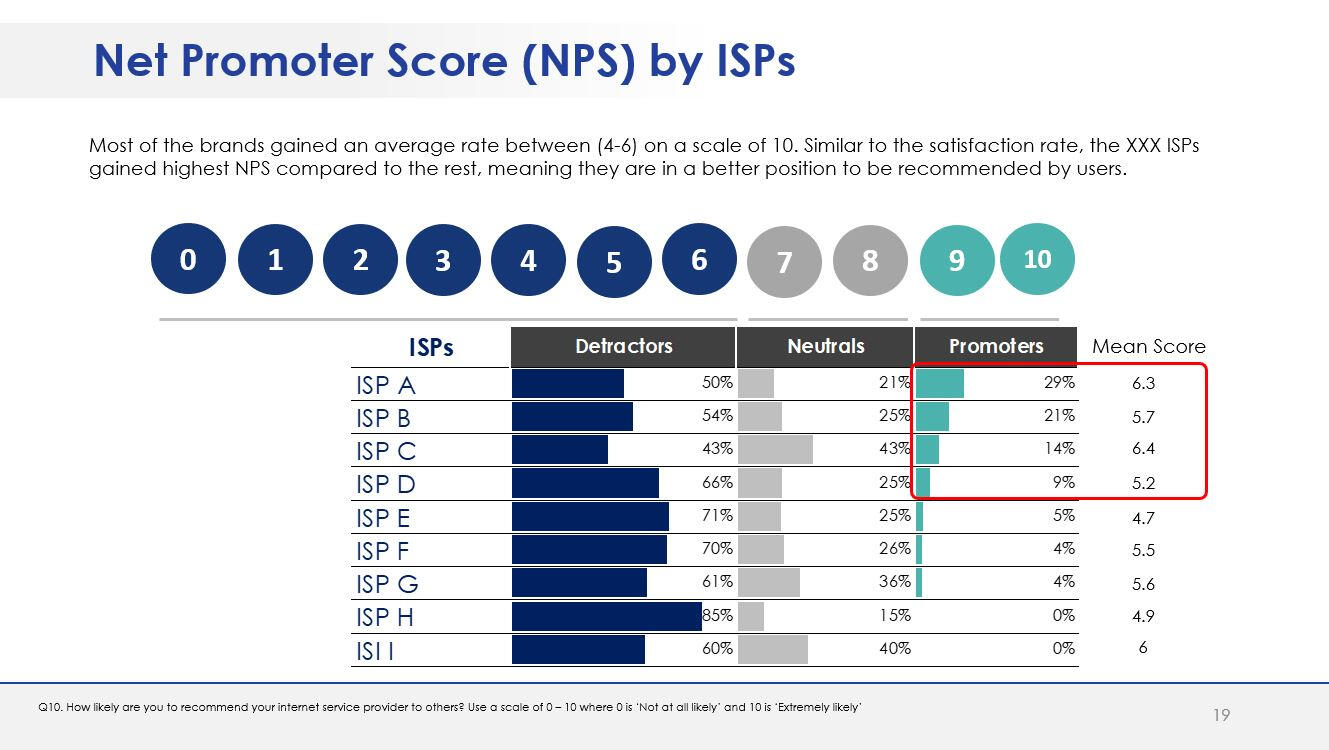
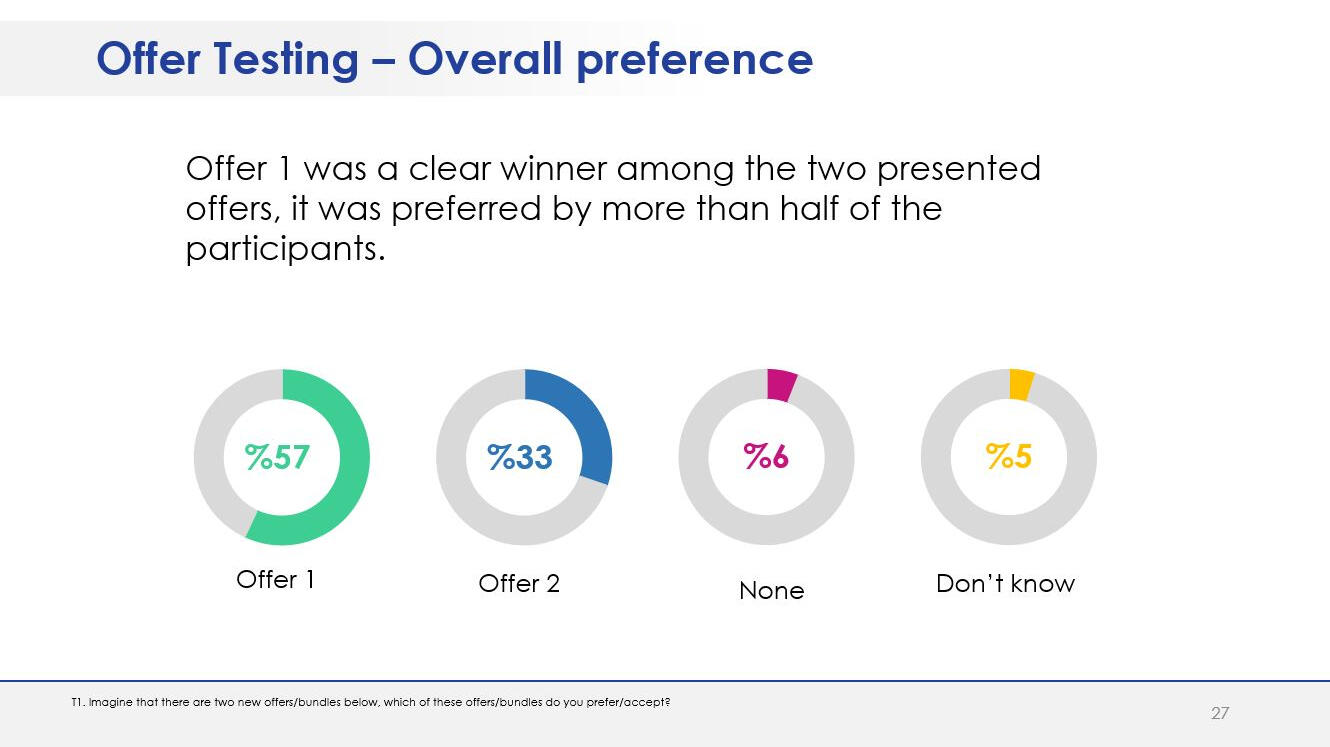
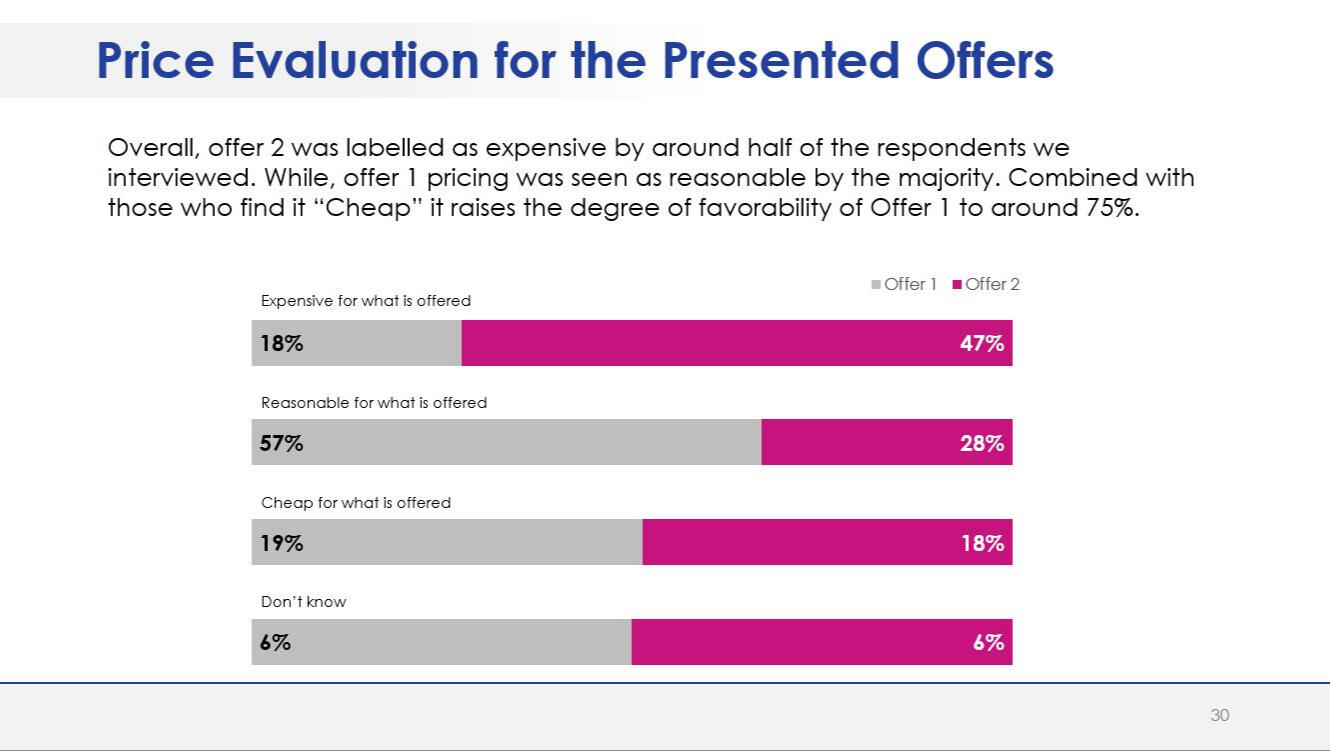
This quantitative study attempted to analyze internet user behavior in 6 different areas, it aimed at identifying market players, asses user spending behavior, measuring satisfaction levels with the existing ISPs, and testing two designed offers to determine the likelihood of a purchase.
Survey Programming | Utilizing Key Functionalities
Well-designed surveys capture the essence of what researchers need, reduce unnecessary time, and capture critical insights. Survey programming involves transforming a questionnaire from a document into a working survey, implementing survey logic, and ensuring that the survey flows logically from start to finish. This will ensure that participants can interact with the survey easily.
SPSS, EXCEL & Power point | Consumer Survey – Internet Service Providers Market Analysis Report
Key research objectives included:- Understand user behavior in those identified areas.
- Identify the market leaders and top ISPs.
- Assess user spending behavior.
- Measure current satisfaction levels of the available ISPs.
- Assessing switching behavior among consumers.
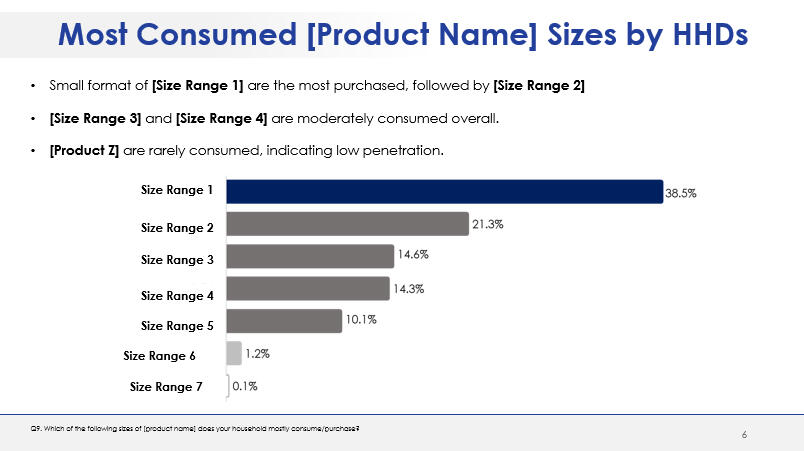
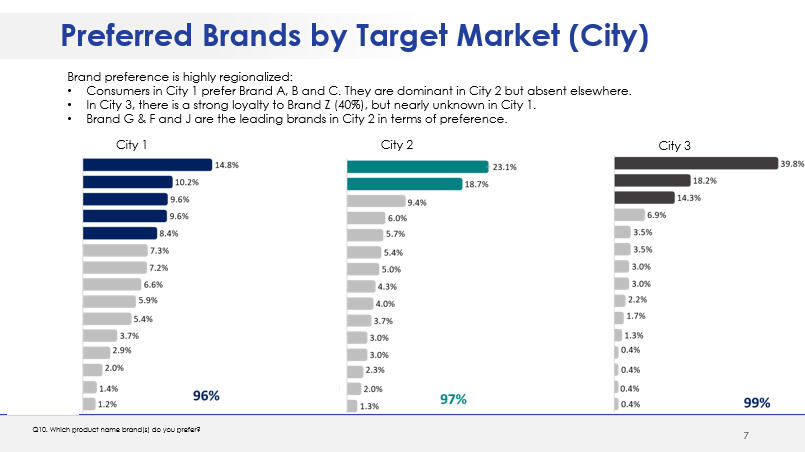
- Testing two designed offers in terms of price and likelihood to purchase.A questionnaire in English was designed in line with the research objectives. The questionnaire was translated into Arabic and Kurdish prior to scripting.The survey was programmed using SurveyToGo Dooblo. Following the fieldwork, the collected data were processed and analyzed using IBM SPSS. The report was developed using standard PowerPoint format.
* SPSS Extract Example
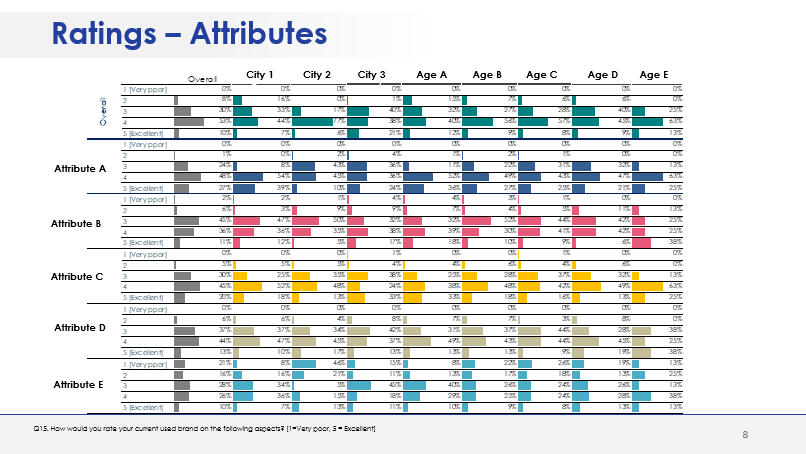
* SPSS Output in Excel Format Example
* PowerPoint Slide Output Example
Power BI Interactive Dashboard – Hospital Satisfaction Survey
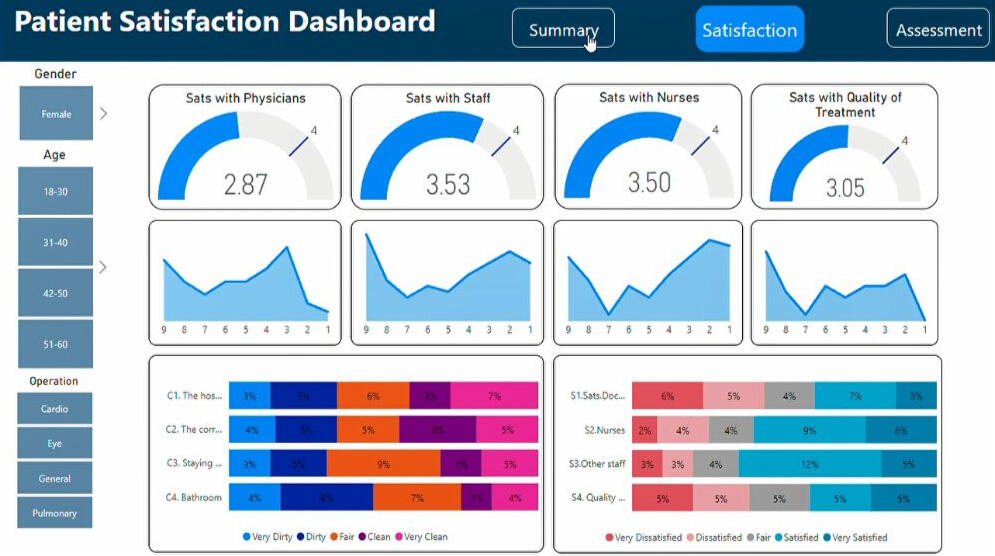
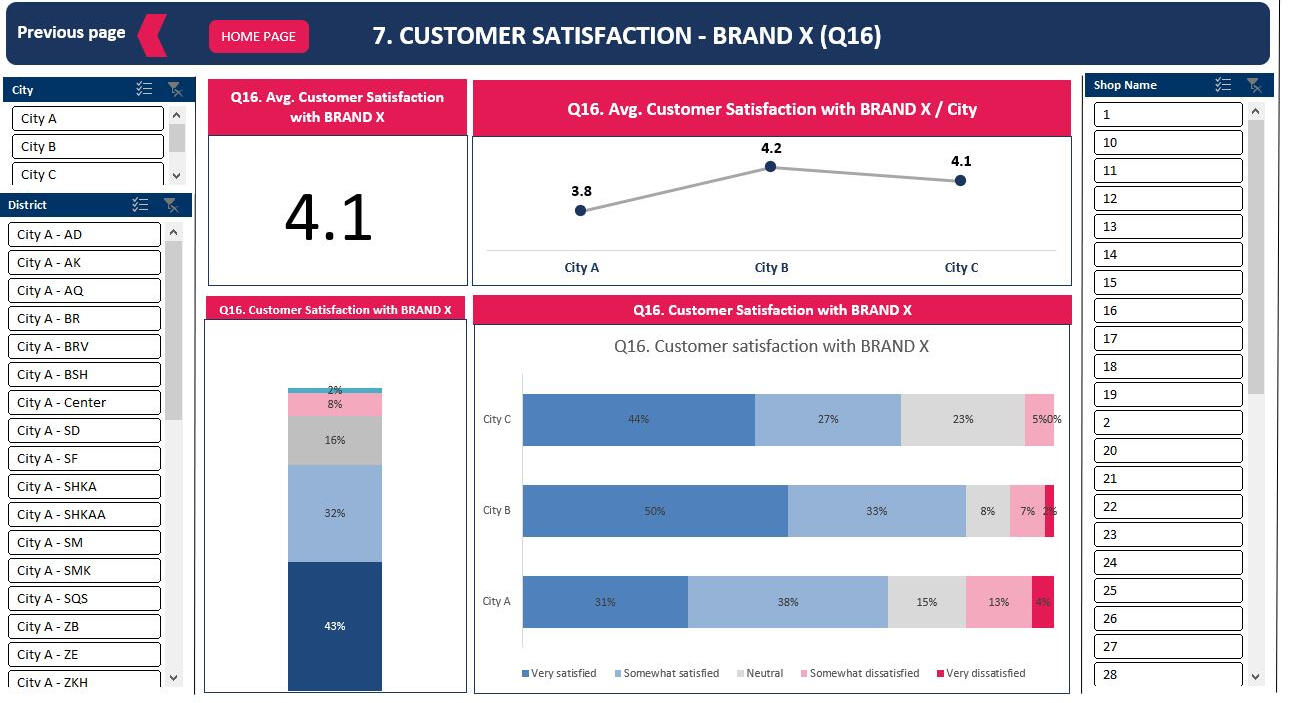
This interactive report was created for a hospital satisfaction survey program using Power BI.The following steps needed for implementing this project:- A questionnaire was developed and programmed using survey monkey.- A pilot test was run, the collected data was processed using Power BI query.- A final dashboard and key metrics were developed upon hospital demands, such as Avg. Satisfaction with Physicians, Nurses, Staff, and overall quality of the treatment.
Excel | Interactive Report - Point of Sales (POS) Survey
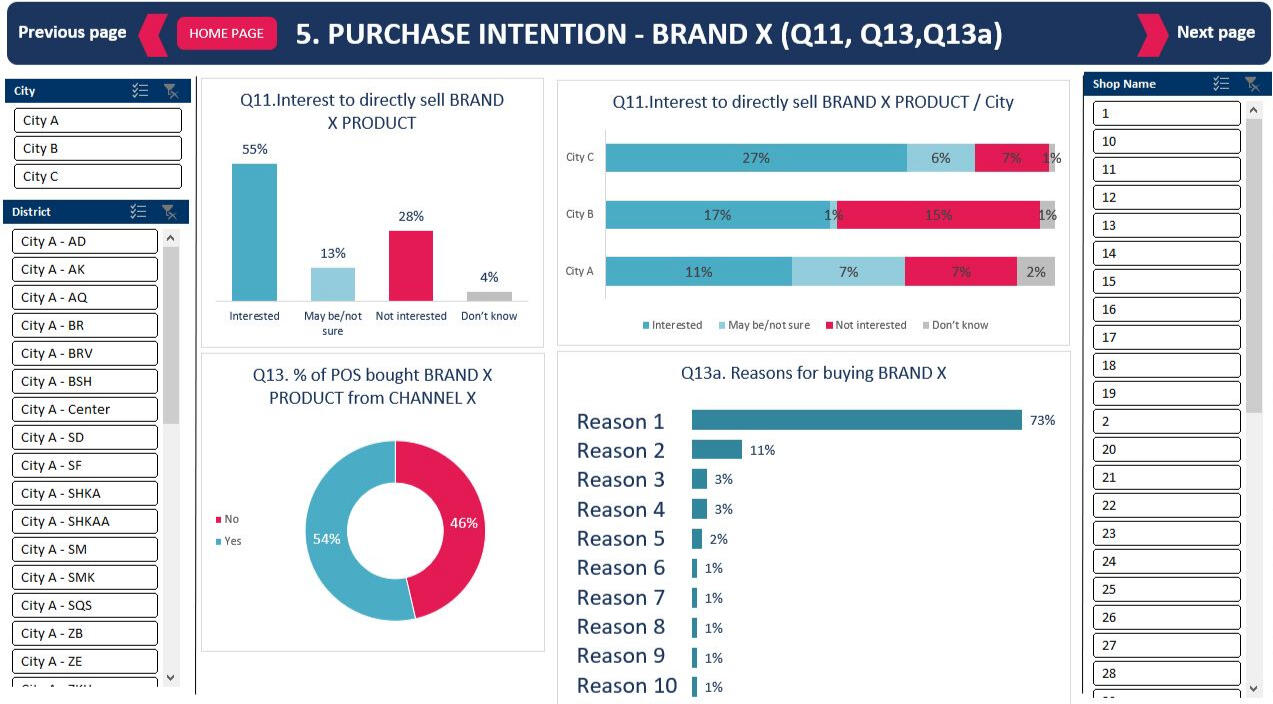
This is an illustration of a project that was done to examine
a brand’s sales performance across different point-of-sale (POS) levels. Routinely, a questionnaire was developed, scripted, and pilot-tested before carrying out the data collection phase.An interactive dashboard was created by processing the gathered data and presenting the findings. This is mostly because the findings were dispersed over several cities, districts, and store levels. Therefore, it was crucial to thoroughly cover each of those levels.
SPSS & Excel | Data Tabulation – Branding Survey
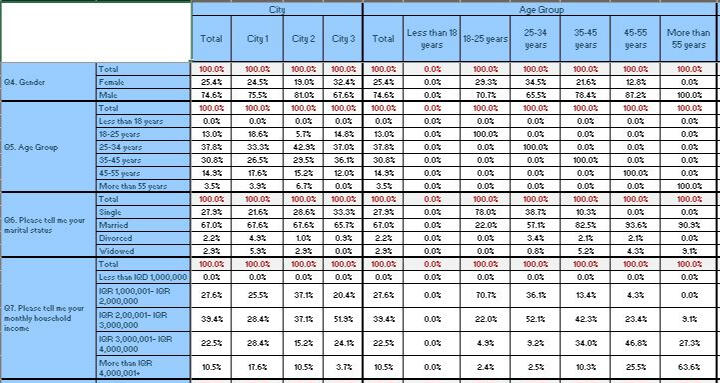
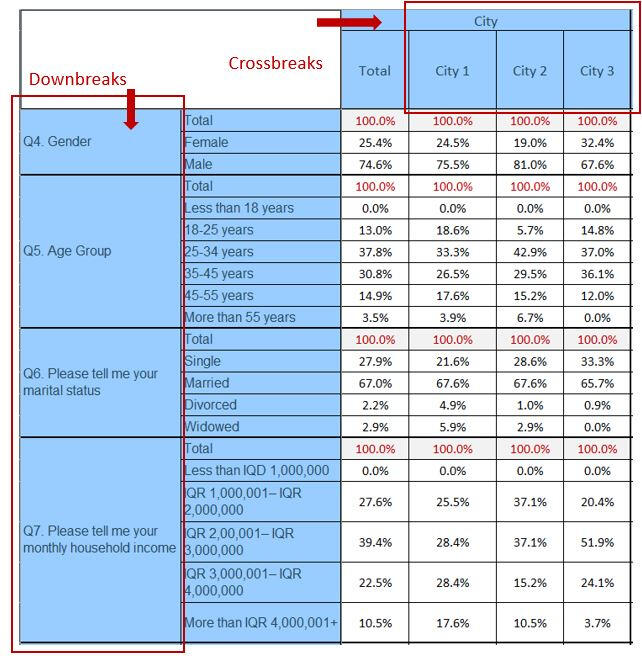
Presenting a survey project result in table format (i.e. crossbreaks and downbreaks) for comparison, interpretation and building reports, using SPSS for data processing and Excel as output method.The raw data was processed and cleaned in SPSS before creating tables. Necessary variables added/modified for analysis purposes. For example, the age input changed from an open-ended format to a group response to enhance interpretation.All variables of interest are placed in row and column levels. The output was set as column %. The table was extracted to Excel format in the final step.

Survey Programming | Utilizing Key Functionalities
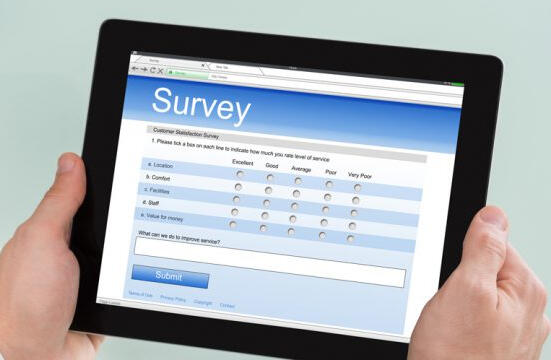
Well-designed surveys capture the essence of what researchers need, reduce unnecessary time, and capture critical insights. Survey programming involves transforming a questionnaire from a document into a working survey, implementing survey logic, and ensuring that the survey flows logically from start to finish. This will ensure that participants can interact with the survey easily.A great online survey is not just about asking questions; it's also about creating a smooth user experience for respondents to gather high-quality and relevant data.
Programming a survey also ensures data integrity by reducing human errors, limiting responses to specific options, and automating question flow. It helps prevent false or fraudulent answers, which could corrupt the data.
This leads to cleaner data and reduces the need for manual intervention. In essence, survey programming doesn't just help gather insights; it fine-tunes the data needed to achieve market research goals.Throughout the research projects that I have worked on, I managed to program +40 projects since 2019, mainly using SurveyToGo Dooblo, QuestionPro and SurveyMoneky.
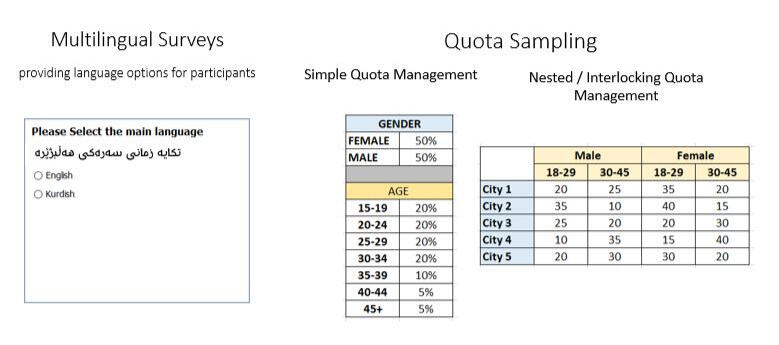
Below are some of the syntaxes I have used during my survey scripting journey:- Adding Language:
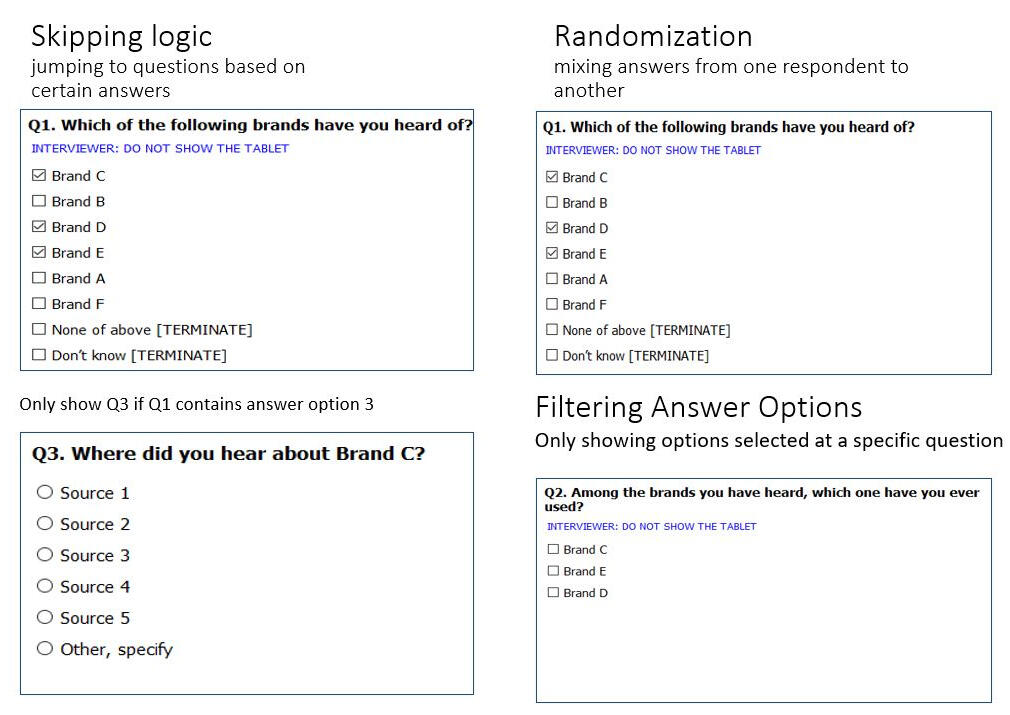
LanguageMgr.SetLanguageByID(Answer(CurrQues));- Randomizing answer options to avoid recency and latency:
RandomizeAnswers(CurrQues);-Showing only answer options selected at the previous question:
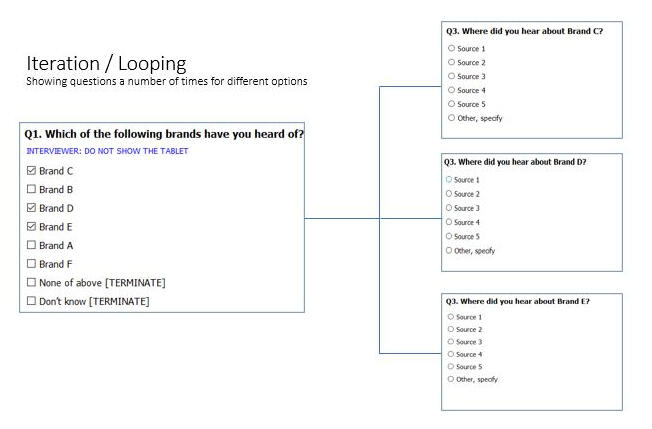
FilterAnswersByAnswers(CurrQues,(target question code, true);- Showing only selected options & showing entered texts:
FilterAnswersByAnswers(CurrQues,QRef(X));
if (Contains(QRef(target question code),answer option number))
{
SetAnswerTextFormat(CurrQues,answer option number,AdditionalAnswerText(QRef(target question code),answer option number));

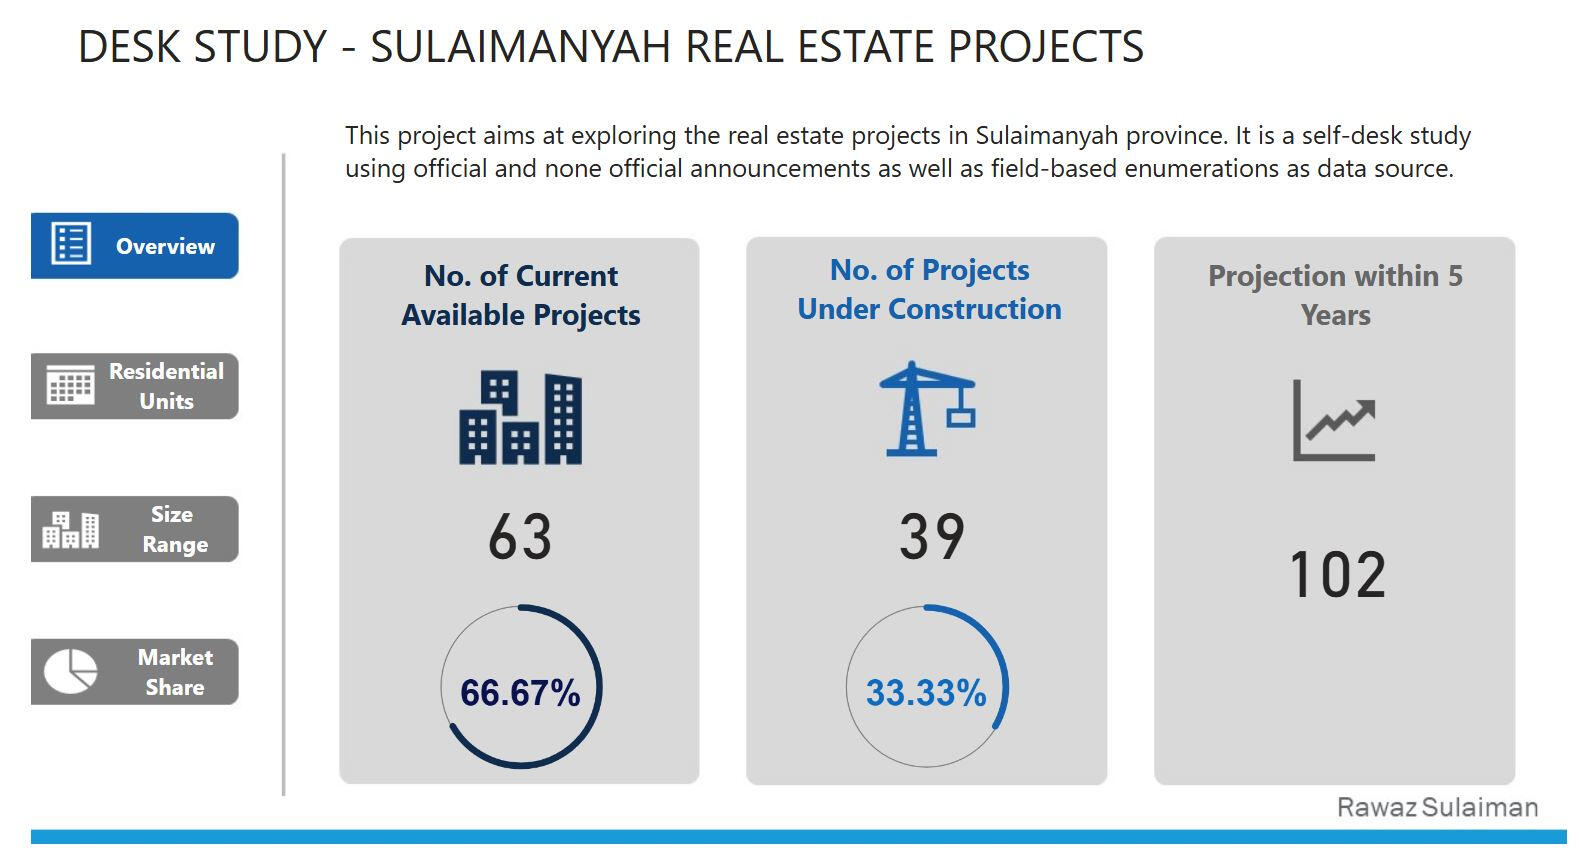
Desk research | Real Estate Projects in Sulaymaniyah, 2023
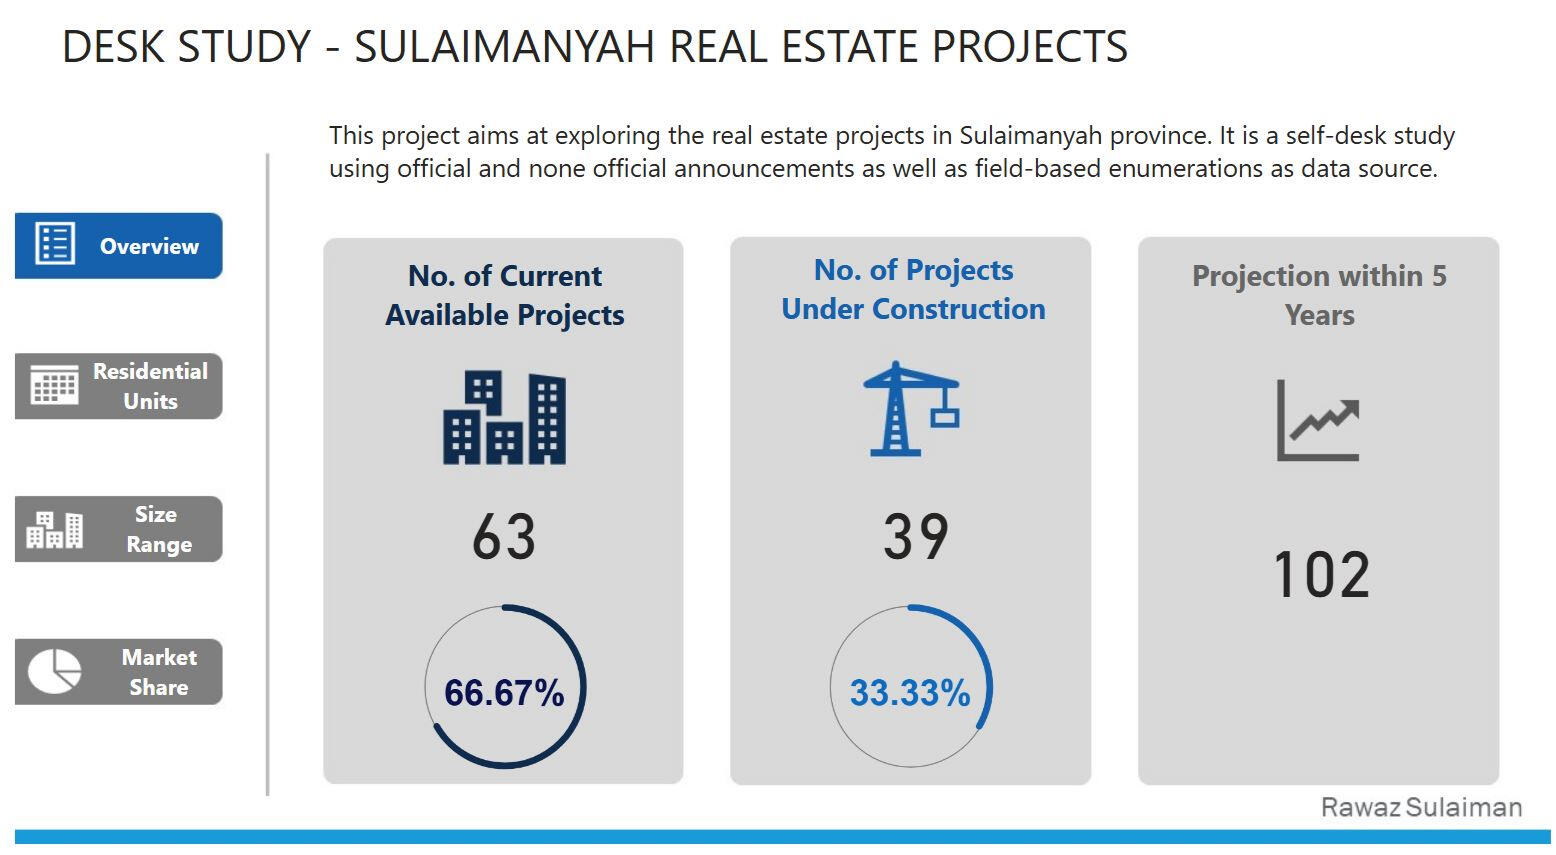
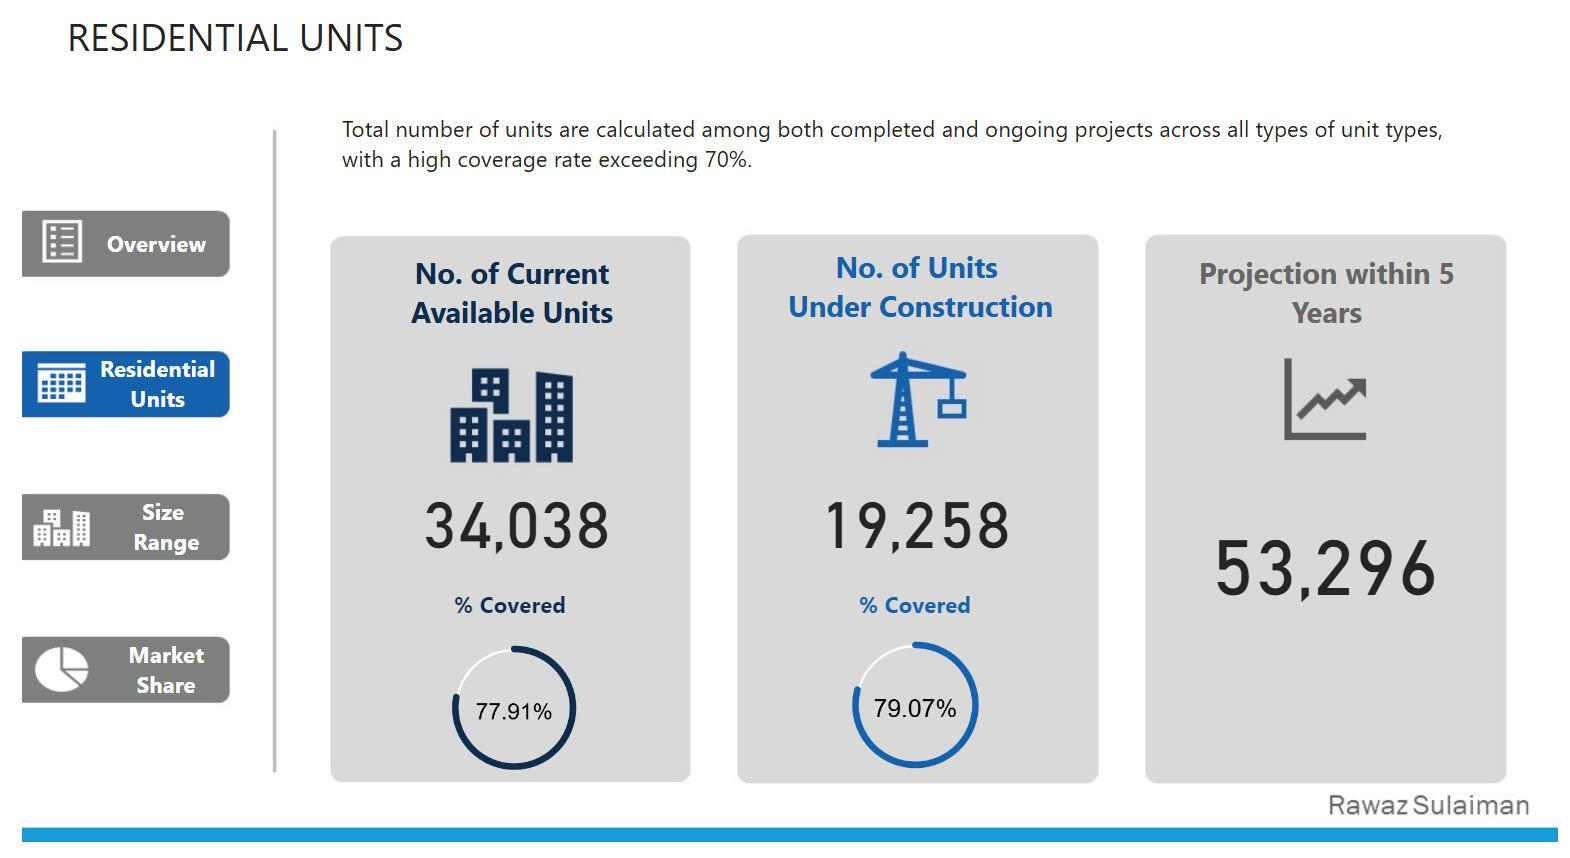
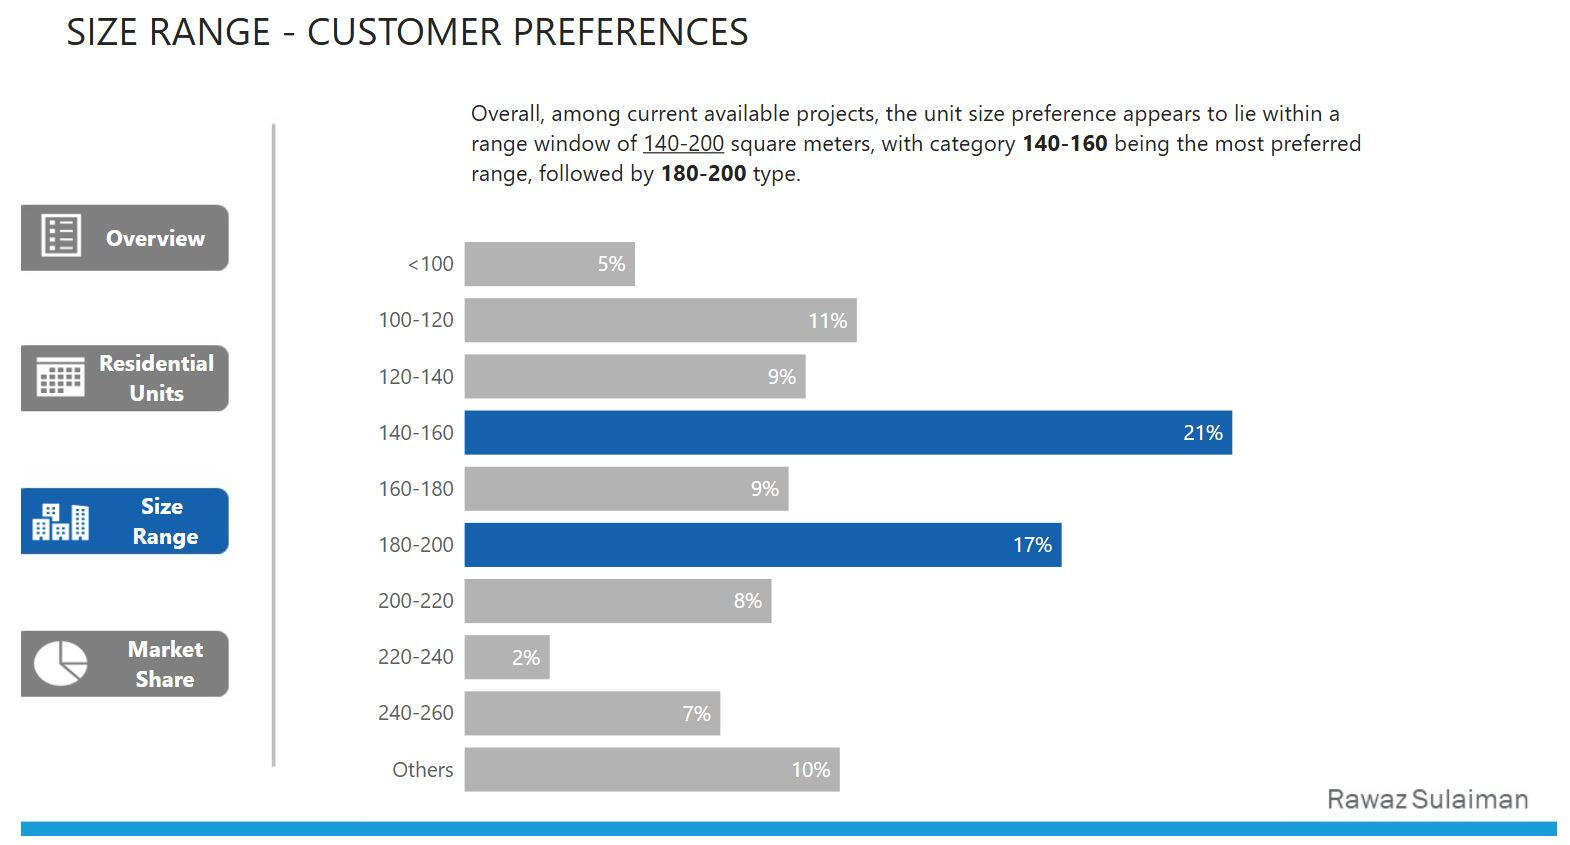
This desk research report tries to provide an overview of the real estate market in Sulaimanyah, Iraq, by looking at some key metrics for both completed and ongoing projects.These metrics include the total No. of projects and units along with customer preferences regarding residential unit selection.- First, the raw data was provided in tabular format, i.e. Excel tables. These included; project name, type, size, status, No. of buildings, No. of floors and number of units.
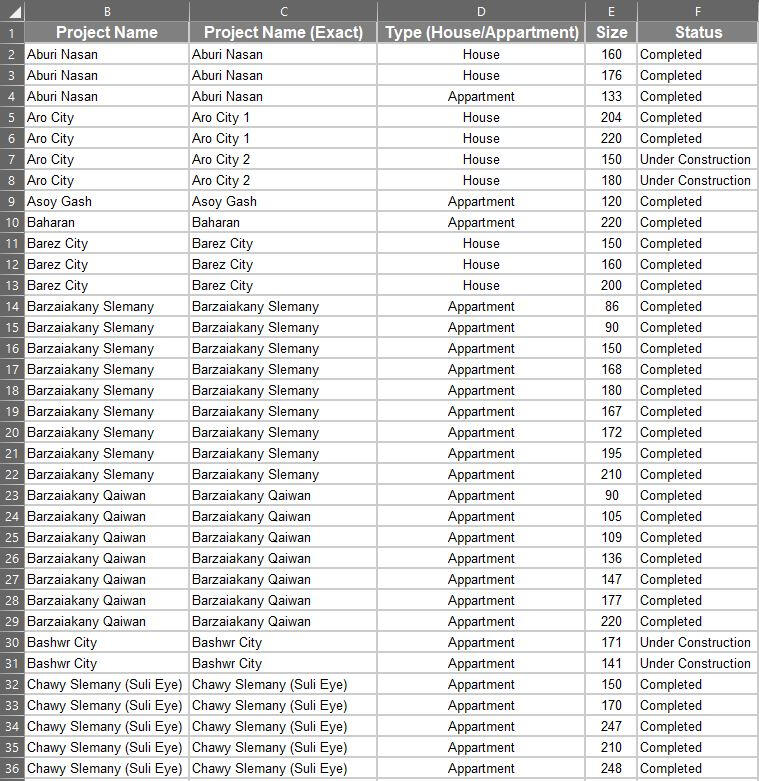
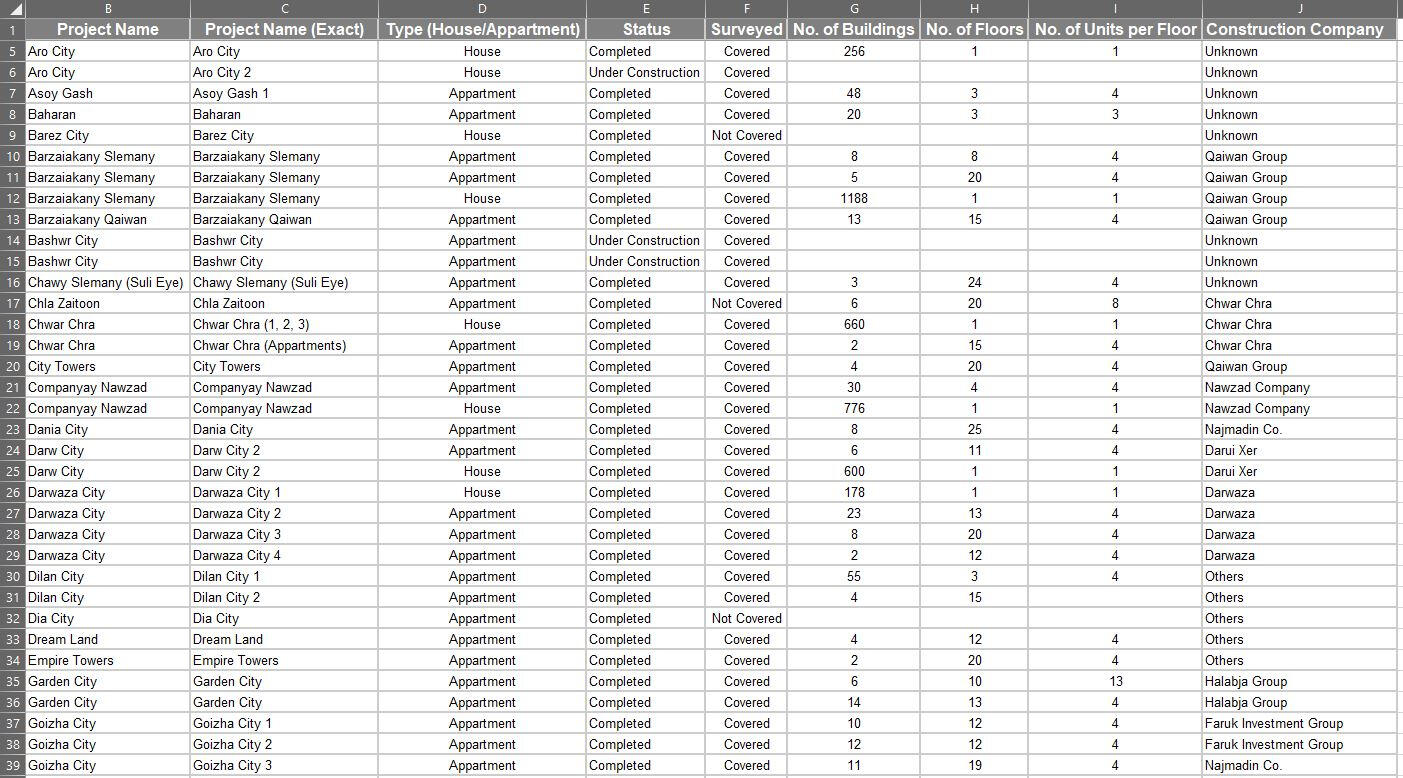
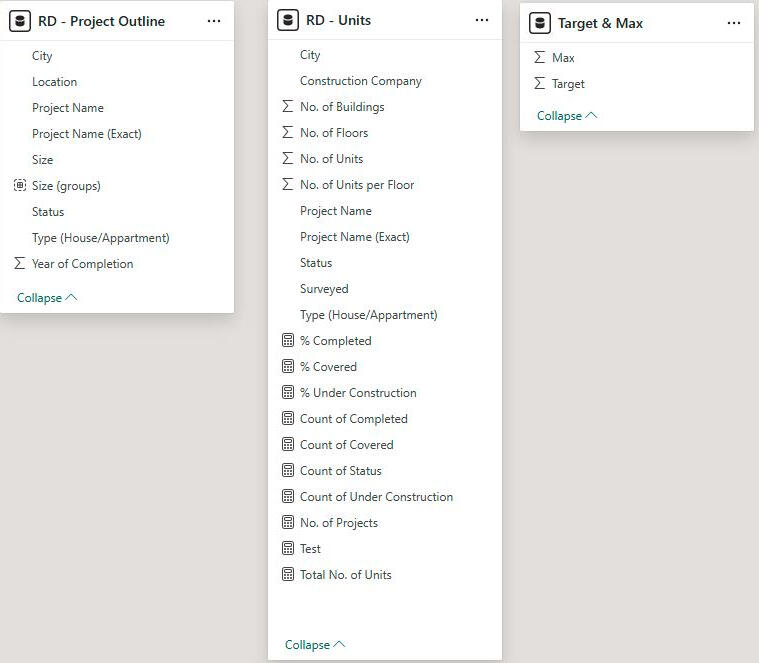
- The raw data was processed and transformed using power query within Power BI. Specific measures were added to the data model using DAX expressions; chief of which are % completed & % under construction, no. of projects, etc.Below are some examples of the used DAX expressions:* No. of Projects = DISTINCTCOUNT('RD - Project Outline'[Project Name (Exact)])* Total No. of Units = SUM('RD - Units'[No. of Units])* Count of Completed = CALCULATE(COUNT('RD - Units'[Status]),'RD - Units'[Status]="Completed")* Count of Covered = CALCULATE([Count of status],'RD - Units'[Surveyed]="Covered")* % Completed = DIVIDE([Count of Completed],[Count of Status])
Market study | beverage consumer survey
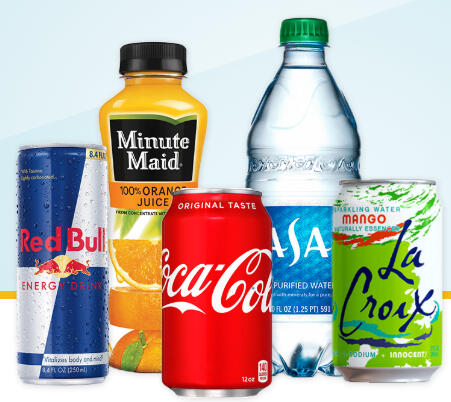
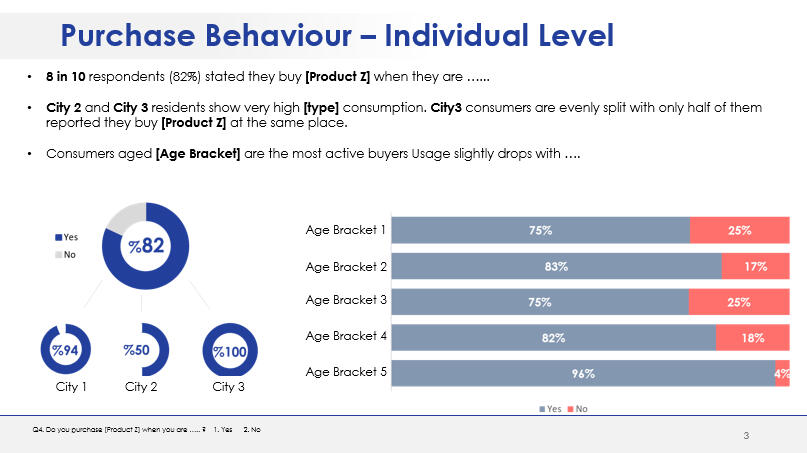
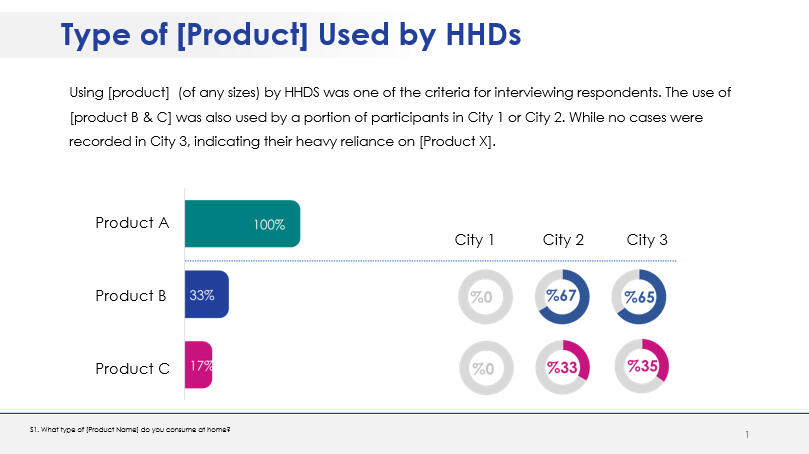
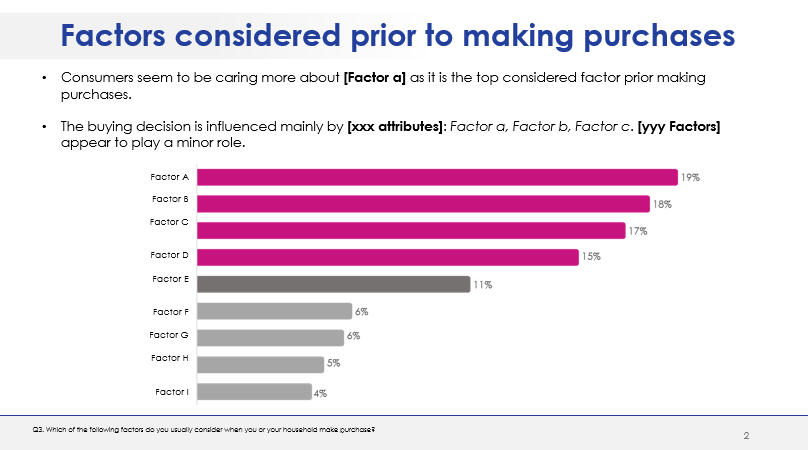
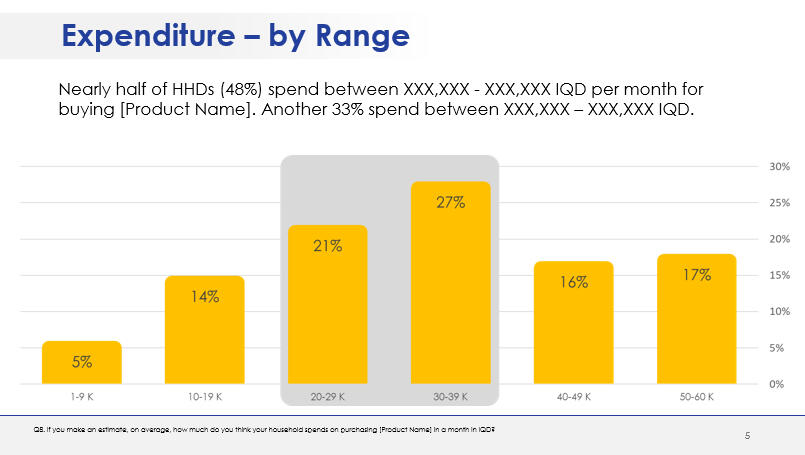
This consumer survey project aimed at exploring the beverage market in Iraq, focusing on three main cities with a specific scope on bottled water.Specific explored areas included:- Purchase behavior, including factors involved in purchase consideration.
- Type of consumed products.
- Purchase channels.
- Monthly expenditure.
- Preferred brands.
- Satisfaction with the existing brands.
